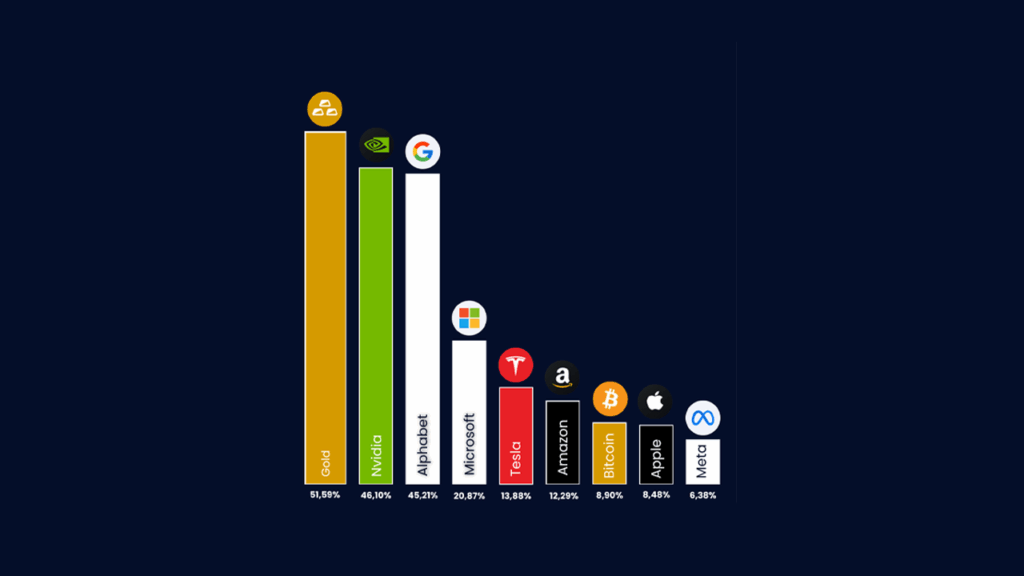
The chart stacks the YTD performance of the MAG7 next to Bitcoin and gold. The picture is striking. Gold stands at 51.59 percent. Nvidia follows at 46.10 percent and Alphabet comes in at 45.21 percent. After that the pace cools with Microsoft at 20.87 percent, Tesla at 13.88 percent, and Amazon at 12.29 percent. Bitcoin shows 8.90 percent, Apple 8.48 percent, and Meta 6.38 percent. This is not the classic tech lineup from last year. It is a snapshot that shows where money flows right now and where investors are more careful.
What this leaderboard says about sentiment
The number one spot for gold signals a search for comfort outside pure growth. Gold does not throw off cash. It works as a refuge when the market wants safety. The fact that it tops the biggest tech names and also Bitcoin shows that risk is not rewarded in one simple way. Money prefers a blend of defense and technology this year rather than an all or nothing bet.
At the same time the second place for Nvidia shows that the AI engine still runs. A return of 46.10 percent tells you that demand for compute is not only a theme in slides. It shows up in year to date results. Alphabet at 45.21 percent proves that search and ads still matter even as AI rises. Profit, cloud and new AI tools keep momentum alive and that shows up on the podium.
After that the field looks more mixed. Microsoft is clearly positive but less spectacular than the leaders. That suggests some of the expected growth was already priced in when the year began. Tesla and Amazon print gains, yet the scale hints that the rerate needs a fresh spark. For both it comes down to the pace at which margins and new initiatives surprise again. The middle of this chart speaks the language of selectivity.
Why the tail tells a story
The lowest YTD prints may grab less attention, but they carry useful signals. Bitcoin is not on top despite its turbo image. At 8.90 percent it trails gold and parts of the MAG7. That is not a verdict on the future of crypto. It is a reminder that volatility cuts both ways and that loud headlines in January do not guarantee a lead in November.
Apple and Meta close the list at 8.48 percent and 6.38 percent. That does not make them dull. It shows that even mega caps need time to turn new growth drivers into visible progress within the current year. For a portfolio this means that spreading within the same group does more than swapping logos. The MAG7 is not a single block. Each name moves on its own fuel, with its own cycle and its own sensitivities. Read the board this way and the picture makes sense.
How to use this chart the smart way
A YTD chart is a snapshot. It tells you who covered the most ground since January. It does not tell you when the moves happened or what swings sat in between. Use it as a starting point for questions. Where does the strength of the top three come from. Is it profit growth, a fresh product, or a catch up in valuation. What explains the slower pace in the chasing pack. Are headwinds temporary or is there a structural shift. This way you avoid chasing what already ran and you also avoid writing off what paused.
Next connect the view to your own aim. If you want stability, the role of gold is instructive. If you want growth in technology, the chart shows that not every mega cap runs at the same speed. A basket of large names is not a ticket to the average of the leaders. It is a set of individual stories that happen to live in the same index. The lesson is simple. Combine theme, quality and timing. Let YTD returns guide you, but do not let them set your full route.
Conclusion
This image cuts through a stubborn idea. Tech does not set the only rhythm this year. Gold leads. Nvidia and Alphabet show that AI and ads can print real money. The rest of the MAG7 plus Bitcoin move in different gears. Read the chart this way and you no longer see one winner. You see a market that rewards several flavors at the same time. Use this scoreboard to sharpen your process. Look at each name, ask which engine drives it and why, and compare that to your own goals.
Ready to turn this insight into action. Open the Bitease economic calendar and explore the asset index to plan your next deep dive.